A Neoproterozoic Snowjob: Testing the Limits of the
Snowball Earth Hypothesis
Nicholas
Christie-Blick (Columbia University, New York, New York, USA)
Ohio State University’s Geology Department colloquium
(Columbus, Ohio, USA)
25 April 2002
Paul
Hoffman’s Snowball
Earth Hypothesis (SEH) doesn’t work very well.
A
classic locality for seeing Neoproterozoic tillite is in northern Namibia.
Marinoan
Ice Age (= Varanger Ice Age) - ~600 m.y. & the Sturtian Ice Age - ~750-700
m.y. These appear to be the most severe Ice Ages ever on Earth.
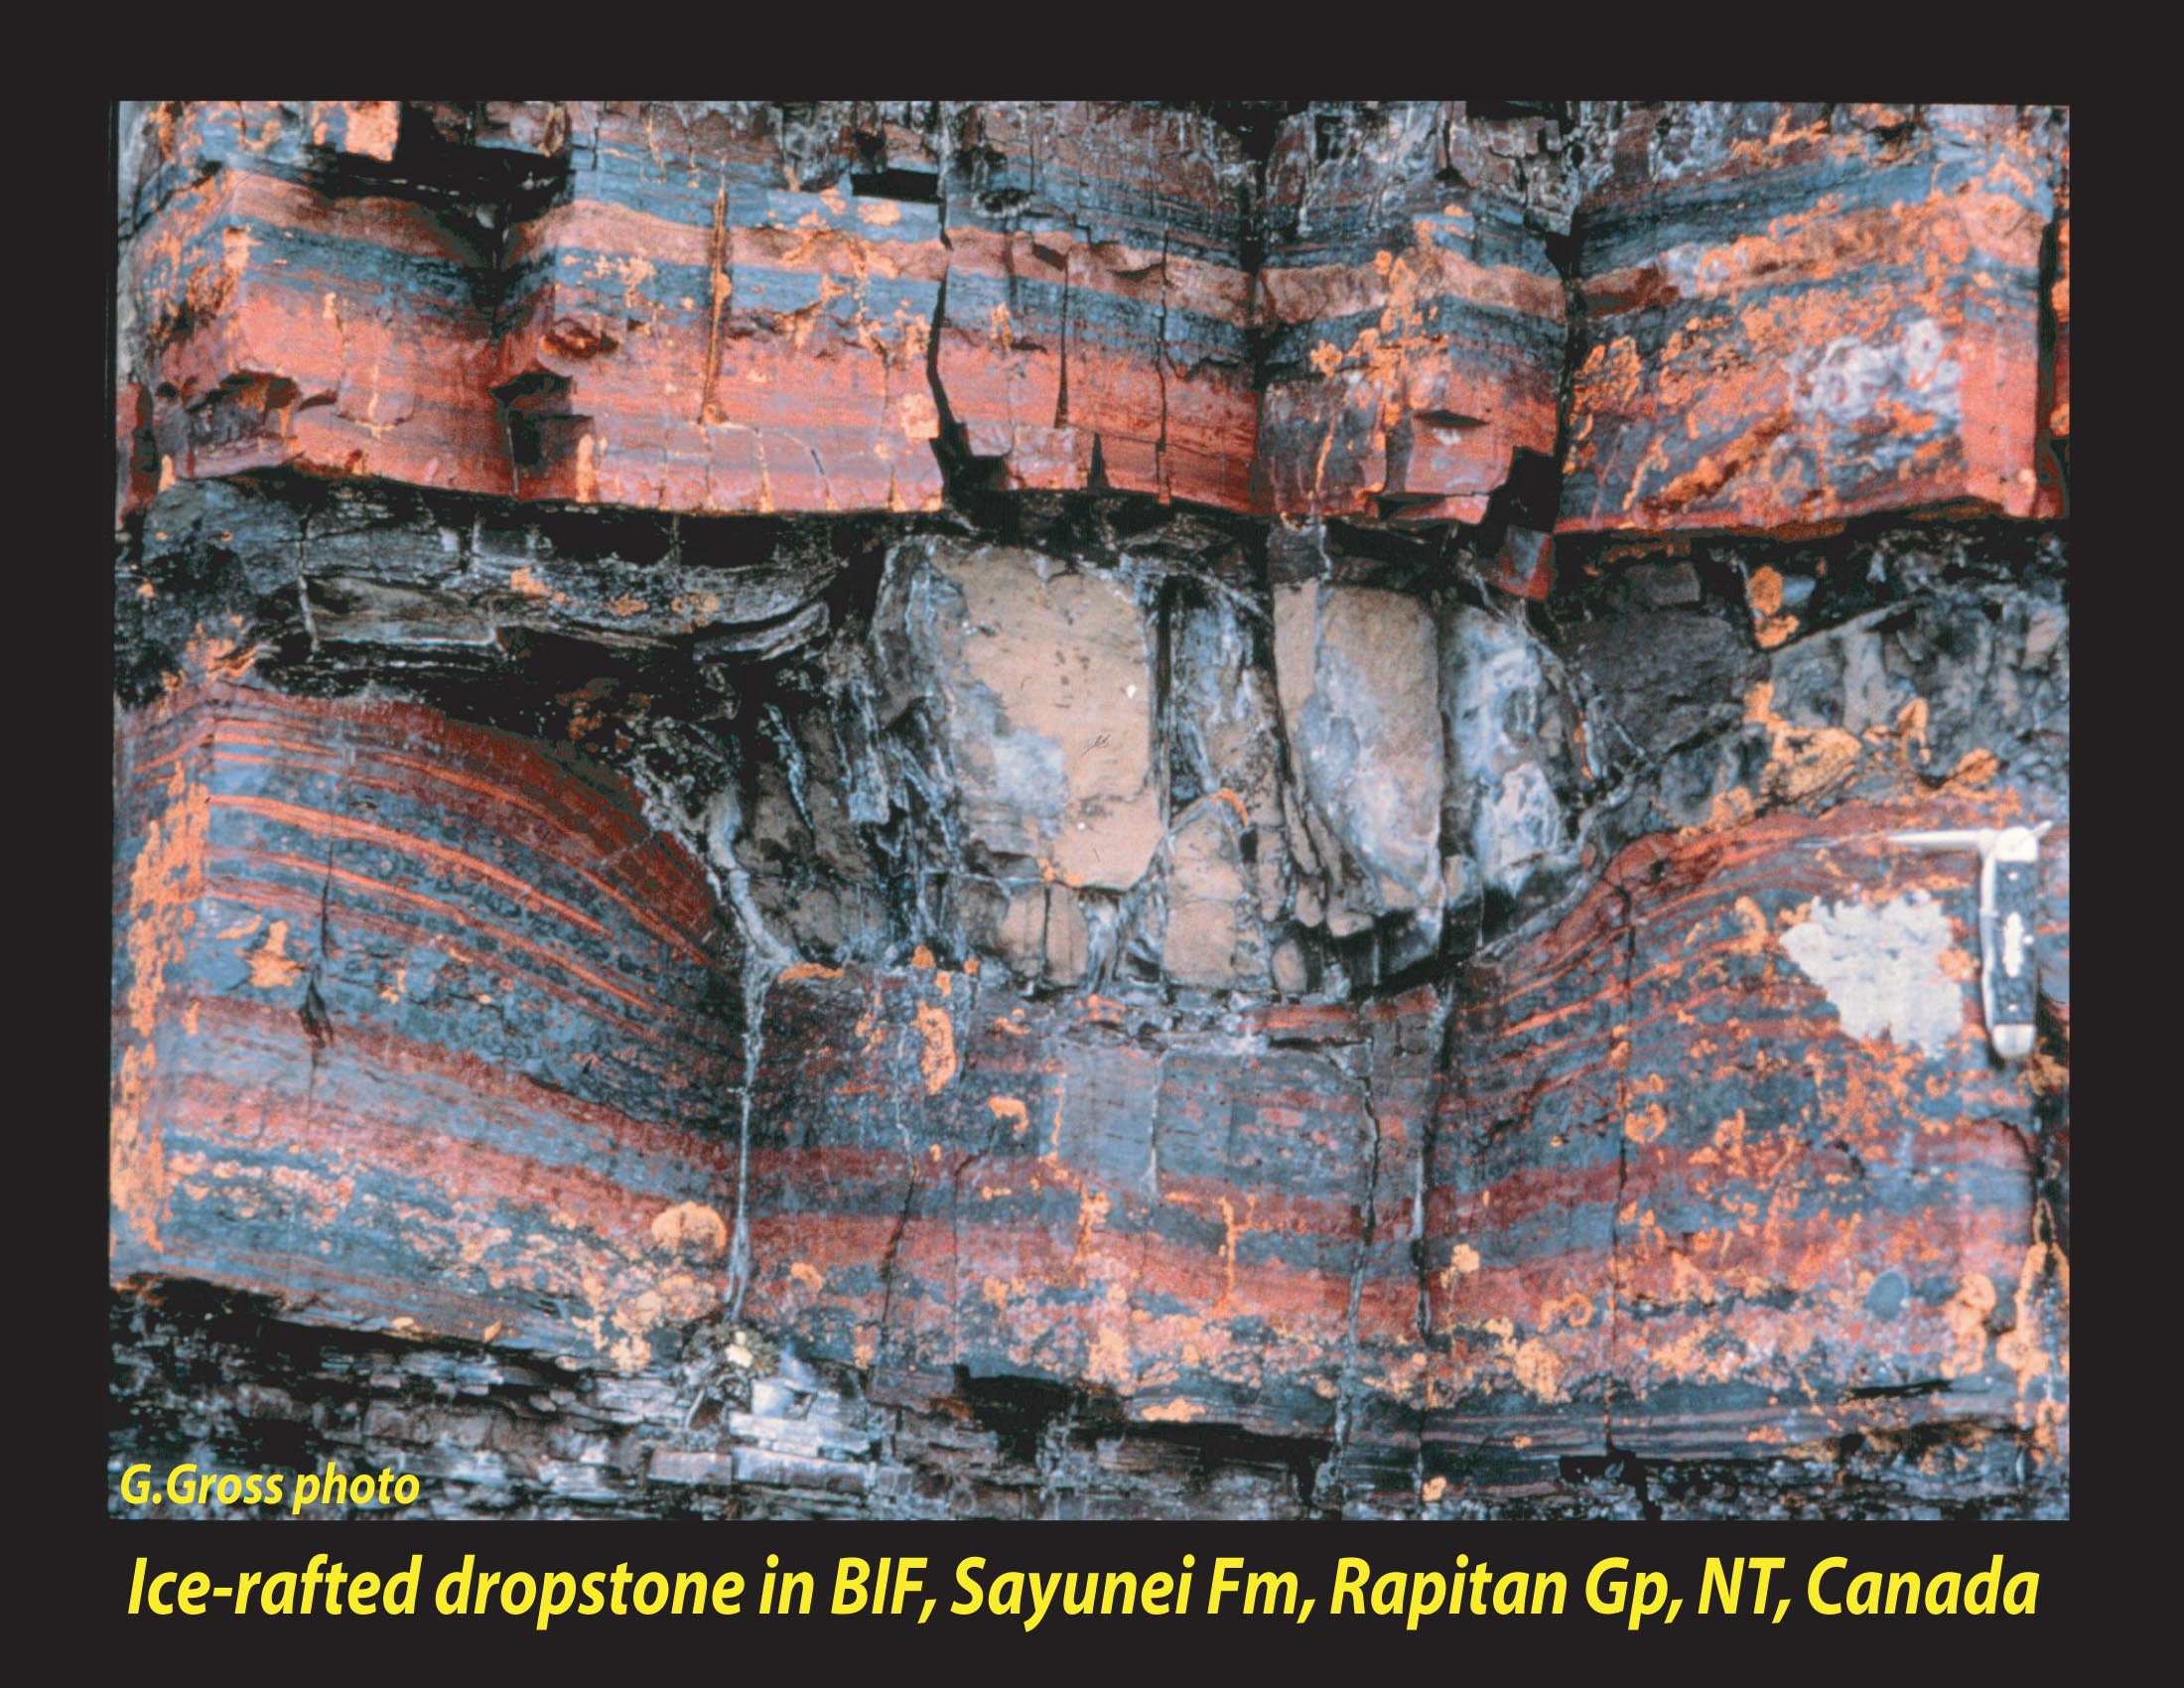
Showed
a photograph of a large
dropstone deforming iron formation (photo from Paul Hoffman).
Evidence
for a cold climate at sea level ~600 m.y. ago: striated pavements, paleo-permafrost
(sandstone frost wedges), adjacent to tidal bundles in sandstone.
The
Elatina Formation in the central Flinders Ranges, South Australia has the best
evidence for low-latitude glaciation at sea level - paleomag. shows this locality
was at 7.5˚ North latitude (results are close to a primary
position). See lots of magnetic reversals in the Neoproterozoic glacial
interval of the Elatina Formation. This area really made the case for
low-lat. glaciation.
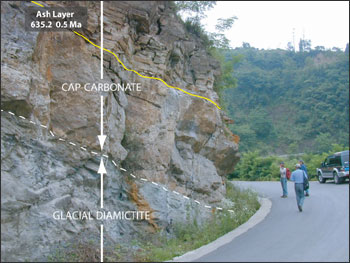
The
typical cap carbonate
facies - occurs above Snowball Earth glacial sediments. The cap
carbonates are peculiar. In the late Precambrian, can see carbonates
above the glacial interval. The cap carbonate sediments (deep water and a
continuous interval) are event beds - turbidites (sole marks, flute casts) of
finely-laminated, homogeneous dolomicrite. They directly overlie glacial
rocks everywhere. They are present even in terrigenous sections. Most
sections have a few meters only of cap carbonates, though Hoffman focuses on
the few sections that have 100s of meters of cap carbonates. See Kennedy,
Christie-Blick, & Prave (2001).
Low
isotopic values in cap carbonates are perceived to be peculiar.
-5.5
to -6 d13C
(PDB) is the mantle carbon isotopic value. The modern world has Corg
about -28.5 and Cinorg.CO3 of 0. We see mantle carbon values
in Neoproterozoic cap carbonates - implies zero Corg burial - the
source of the suggestion of completely ice-covered oceans in the Hoffman
Snowball Earth Hypothesis (SEH). d13C curves go crazy during the Neoproterozoic, compare
with pre-NP and post-NP.
Snowball 101: the
basic ideas of SEH.
1)
Freezing phase - the entire ocean surface is frozen (even in the
tropics) from a runaway albedo feedback. When sea ice reaches 30˚ latitude,
the rest rapidly freezes over. Then, primary productivity in the oceans
ceases, which accounts for mantle carbon values in cap carbonates. Then,
atmospheric CO2 increases to ~120,000 ppm due to the shutdown of
hydrologic cycle and the shutdown of silicate weathering (both sinks for CO2).
The increasing CO2 is coming from the mantle (continued volcanism
from continuing plate tectonic processes).
2)
Melting phase - catastrophic melting phase from greenhouse effect, on a
scale of 100s of years - very rapid and very warm. This renews silicate
weathering, resulting in drawdown of atmospheric CO2, which delivers
alkalinity and base cations to the ocean. The cap carbonates record the
transfer of excess atmospheric CO2 to the ocean. The trend of
decreasing carbon isotope depletion upward in cap carbonates is due to: 1)
protracted shutdown of marine autotrophic activity; 2) high fractional burial
of carbonate carbon; and 3) Rayleigh distillation.
This
is the freeze-fry cycle of the SEH (Hoffman, 2000). This
freeze-fry cycle is on the order of 10 million years. The SEH is
advocated by Hoffman and others because it plausibly explains many paradoxes in
the record.
How
to test SEH?
Global
climate model simulations - the catastrophic freeze over starting at 30˚
latitude is actually the result of an artifact in a previous climate model.
Look
at carbon isotopes in synglacial carbonates (look at non-eroded carbonates
only, though).
Sr
isotopic information - a measure of weathering influx.
Implications
to evolution - what are the evolutionary responses and what about bottlenecks?
Continental
locations - equatorially-located continents are “surprised” in the SEH model -
the ice creeps toward them from the poles, then reaching 30˚ latitude, and
quickly covers the remainder of the planet. Are the continents really all
equatorially-located, though, at the required times?
Well,
lots of modeling is going on now - each has different purposes, and it is
difficult to compare them all. But, can you freeze over the whole ocean
at all in climate models? Maybe, but very hard to do. Not a chance,
say lots of people.
Models
start off with CO2 at 315 ppm (corresponding with pre-industrial
levels). In the Marinoan world, many continents are at low latitudes
(including Australia). The models can’t get an ice sheet remotely close
to Australia. What about changing solar luminosity? In the
Neoproterozoic, sunlight intensity was less than now, estimated to ~94% of
modern intensity. This value is based on astrophysicists’ estimates of a
30% fainter Sun at 4.5 by ago, and scaled forward to the late
Neoproterozoic. No astrophysicist has yet argued for changes in the rate
of solar luminosity increase. So, change models to 94% of modern
luminosity. Still can’t get ice at low latitude Australia in the
Neoproterozoic. Add a lower CO2 value of 40 ppm to the model,
can get oceanic ice sheets close to the tropics, but still don’t have an all
frozen ocean - not close.
Look
at synglacial carbonates - we now have data about this from 4 continents.
Look at marine cements, peloids, oolites (in-situ carbonates in glacial
interval). The values are scattered, but typically they are positive, +2
or +3, not -5 as SEH says (supposed to be close to mantle carbon values, since
all Earth is frozen, and only carbon input is from mantle, through plate
tectonic-driven volcanism).
Strontium
ratios are ~invariant throughout the glacial to post-glacial interval. No
evidence from Sr for a 1000 fold variation in weathering rates (as expected in
Hoffman’s SEH). The maximum weathering rate for an atmosphere with
120,000 ppm of CO2 is <50x present.
Secondary
hypotheses have been proposed to circumvent the Sr problem. They assert a
substantially longer time scale, and they call upon weathering of carbonates,
so not weathering silicates. There are difficulties with these. The
longer timescale argument is inconsistent with high fractional burial of
carbonate carbon, plus the cap carbonates likely represent ~104
years, plus carbonate weathering cannot draw down CO2.
Silicate weathering can, but carbonate weathering can’t. So, cap
carbonates are not a product of CO2 drawdown, which is a key Hoffman
idea. Carbonate weathering drives cap carbonate d13C
values into a positive upward trend.
The
Pleistocene glacial maximum had sea level at 120 meters lower than now.
There is still 73 meters worth of sea level trapped in ice.
Australian
glacial facies and magnetic reversals indicate a glacial retreat over 105
to 106 years (much longer than Hoffman’s SEH says).
Glacial-eustatic
rise continued after glacial-isostatic rebound at low latitudes (cap carbonates
are late glacial - deposited when there was still ice somewhere on Earth).
Australia
has 30 meter thick cap carbonates (event beds - turbidites).
Alternative Hypotheses for the Origin of Cap Carbonates
1)
Post-glacial upwelling (Kaufman et al., 1991). But, it is difficult to
stratify a glacial ocean, and upwelling of nutrient-rich water leads to enhanced
productivity.
2)
Gas Hydrate Hypothesis (GHH) - accounts for the source of light carbon seen in
cap carbonates. Gas hydrates are ice that have methane in the
lattice. They are common in continental shelves - buried frozen
permafrost. Cap carbonates represent destabilization of permafrost
methane hydrates during post glacial flooding of continental margins and
interior basins. Temperature increases, and methane is delivered into the
water column. Need to have a methane source from a reservoir in shallower
areas (permafrost reservoir, for example). Deeper marine reservoirs of
methane aren’t suitable sources for this because a sea level rise will increase
pressure and will stabilize the deep ocean methane reservoirs.
Evidence
for GHH? Widespread features in cap carbonates (CC) are consistent with
cold seep facies. See bedding expansion and cementation in deformed beds
below CC in Australia. See sheet cracks in CCs - cement is growing into
empty spaces. See tubes in CCs - gas escape tubes? They are real
tubes - can see sediment falling into them. See roll-up structures in
sub-photic zone biohermal communities in CCs. See barite and aragonite
fans in CCs - cold seep facies features.
So,
GHH calls upon a pulse addition of light carbon from permafrost methane
followed by steady state recovery. CCs represent ~104 years
(rapid accumulation).
Mass
balance calculations show the plausibility of GHH, using modern ocean
constraints. Carbon introduced by methane release that accounts for a -5‰
shift - need about 3 x 10¹⁷ moles of CH4. Carbon
buried in cap carbonates - estimated 8 x 10¹⁷ moles of CaCO3.
Same order of magnitude.
How
big were the ice sheets in the Neoproterozoic? There is good evidence in
Utah - see incised valley systems in a series of sections - rivers cut into
marine sediments (~160 meters of cutting) - they are the same age as the
glacial interval.
Apparent
sea level change of 193 meters for the Pleistocene Ice Age (120 m + 73 m) -
equivalent to a eustatic change of 130 m (need to multiply 193 m by a factor of
1.4 - this accounts for difference of sea level change values seen from
islands, which experience water loading with sea level rise, compared with sea
level changes that will be seen on the continents).
How
many Neoproterozoic ice ages? All sections show only 2. Multiple
events or not? Multiple events seem to be based on miscorrelation of the
2 ice ages, especially in southern to northern Namibia. Two main events,
apparently. One is at 600 m.y., and one is at ~750 m.y.. All
workers agree that they were the most severe ice ages in history. Not
>2 events.
SEH
is not consistent with C and Sr data together, or with eucaryotic evolution
(some call on a soft snowball, versus Hoffman’s hard snowball, or a slushball
hypothesis), or with the scale of ice-volume changes, or with the duration of
glacial retreat (>105 years, not 102 years).
GHH
is consistent with climate models, outcrop evidence (including strange features
in CCs that have been unexplained for a long time), isotopic data, biological
evidence. Permafrost and associated hydrates should have been unusually
widespread, because lots of glaciation occurred in the Neoproterozoic, which is
accepted by all.
The
upwelling hypothesis doesn’t work. SEH doesn’t work. Any other
hypotheses out there? They are welcome.
Call
any of these ideas “Snowball Earth” if you want - the name doesn’t matter.
Methane
is coming from marine sedimentary basins.
There
was lots of Precambrian organic carbon, including Precambrian oils and Corg
isotopic values that hover around zero back to the Archean.